
Student Name
RSCH FPX 7864
Capella University
Professor Name
Submission Date
Data Analysis Plan
The data collection process should be followed in a systematic way and using a proper analytical method for carrying out data analysis effectively. The strategy will enable a review of all collected data and the development of valid research results. The study will attempt to explore the possible relationship that exists between the essential indicators of the student’s academic performance, including results of the first quiz, final exam, total points accumulated for the course, and GPA of the student’s previous semester. The following variables are used in the research:
Score in Test 1: Score on a continuous scale of 0 to the maximum possible score on the initial test.
- Final Exam Score: A numeric variable used to represent the number of correct answers achieved during a final exam on a scale of 0–100%.
- Total Points Earned: A Continuous variable that shows the sum of all the points that a student scores throughout the entire school year, to a maximum of points possible.
- Grade Point Average (GPA): A numerical measure of a student’s academic achievement over the prior academic history; Range: 0.00 – 4.00 points.
Total-Final Correlation
Research Question
Hypotheses
The Null Hypothesis (H0) is that there is not a statistically significant relationship between the total number of points earned during a semester and the performance on the final exam, H₀: ρ = 0.
Alternative Hypothesis (Ha): A statistically significant relationship exists between the total points a student scores in a semester and his/her performance on the final examination.
Hₐ: ρ ≠ 0.
Quiz 1 and GPA Correlation
Research Question
Is there a statistical relationship between students’ grade point average (GPA) in school and their grade on the first quiz?
Hypotheses
Null Hypothesis (H0): Students’ prior academic achievement (measured as GPA) is not statistically significant with regard to the first quiz score. H₀: ρ = 0.
Alternative Hypothesis (Ha): There is a statistical relationship between the students’ previous academic achievement (GPA) and performance on the first quiz. Hₐ: ρ ≠ 0.
Testing Assumptions
Table 1: Descriptive Statistics
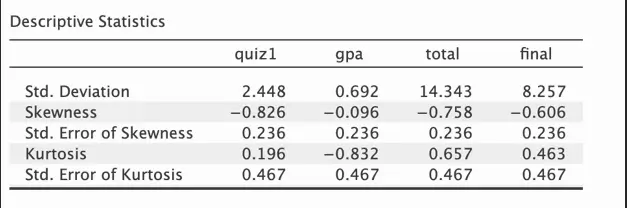
Before statistical analysis, it is important to consider the statistical assumptions prior to the analysis of the data to ensure that the obtained results are valid and reliable. The descriptive statistics revealed that approximately 73.82% of students’ performance was better than their performance in cumulative semester points and final examination grades. Among the variables examined, the most negative was Quiz 1 with a skewness of -0.826, while the lowest was for the GPA of -0.096, very close to being symmetrical.
The values of Kurtosis for all the variables were from −0.832 for GPA to 0.657 for total points earned, which showed no significant deviation from normality. No alarming trends were observed in the measures of variability, and overall the data met the assumptions of being approximately normally distributed. In particular, the index of skewness for total points earned was −0.758, GPA was −0.096, final exam performance was −0.606, and Quiz 1 performance was −0.826, which are all within the acceptable range of ±2.0.
Likewise, values for kurtosis were not greater than ±3.0, another justification for assuming normality. The correlation analysis showed that there was a statistically significant positive correlation between total semester points and the final exam performance (r = 0.659; p<0.001), which led to the rejection of the null hypothesis. On the other hand, the correlation between Quiz 1 performance and GPA was not strong, and the statistical value was insignificant (r = 0.142, p = 0.149); so the null hypothesis was retained.
Results & Interpretation
Table 2: Pearson’s Correlations Between Academic Performance Variables
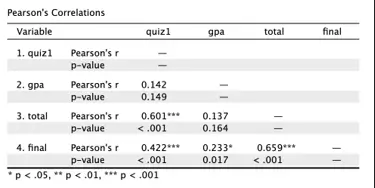
Pearson correlation coefficient was used to determine correlations among continuous variables ranging from −1 to +1, with a higher absolute value representing more correlation. There were some interesting results in the correlation test. Cumulative semester points were strongly correlated with performance on Quiz 1 with r = 0.601 and p < 0.001. Further, the performance on Quiz 1 (r = 0.422, p < 0.001) was moderately and significantly correlated with the performance on the final examination.
By contrast, GPA was only weakly correlated with Quiz 1, with an r value of 0.142 and a p value of 0.149, which wasn’t statistically significant, implying that academic success was a less useful predictor of performance on an initial assessment. The correlation between the GPA and scores gained for the cumulative points during the semester was also non-significant and weakly correlated (r = 0.137, p = 0.164). Nevertheless, a weak but significant correlation (r = 0.233, p = 0.017) was found between GPA and performance on the final examination.
Of the correlations obtained in the analysis, the most important one was r = 0.659 with a significance of p < 0.001 between the total points scored in the semester and the final examination score. The result is very close to zero; therefore, the null hypothesis, which states that there does not exist any correlation between the performance in the semester and results of the final examination, is rejected.
However, the null hypothesis that there is no correlation between the results of Quiz 1 and GPA was maintained because that is not statistically significant. Overall, the findings of this study indicate that a student’s performance during the semester is a good indicator of how he/she will do on the final exam, and that his/her past performance has little relevance to the early results, and appears to increase in significance as the end of the semester approaches.
Statistical Conclusions
Some of the hypothesized solutions were supported by the correlation analysis, as it revealed the existence of statistically significant relationships between the academic performance measures collected at different assessment periods. There was a significant relationship between the different measures of academic performance. Total points shown in the semesters were strongly positively correlated with the Quiz 1 scores (r = 0.601, p = 0.001), while the final examination score was weakly but significantly related to the Quiz 1 scores (r = 0.233, p = 0.017).
However, no significant relationships were found between GPA and performance on Quiz 1 (r = 0.142, p = 0.149), indicating that academic performance did not have a significant impact on early performance in the course. In contrast, there was a weak positive correlation between GPA and total number of points obtained over the course of the semester (r = .137; p = .164) as well as the correlation between GPA and performance on the final exam (r = .137; p = .164), which were also not statistically significant.
The strongest correlation that was found is that of cumulative semester performance with final exam performance (r = 0.659, p < 0.001), which is very strong evidence to reject the null hypothesis. Based on the overall findings, it appears that students’ present course performance is a better indicator of their overall performance in the course than their overall performance in previous semesters. Furthermore, the slight and insignificant relationship between past achievement (measured by GPA) and performance in Quiz 1 suggests that Grade-Point Average at the beginning of the course has very little predictive value for performance at the beginning of the course.
Limitation
The following limitations of the correlation analysis presented must be taken into account. While there were significant correlations among the variables, making it impossible to make any causal inferences due to the fact that correlation is not a measure of causation. Furthermore, none of the possible confounds affecting the observed relations were considered during the analysis. This was performed with bivariate correlation analysis, but did not try to include more complex analyses such as multiple regression analysis. Sample size was also relatively small, and this could affect the generalizability of the results, especially in terms of the correlation between GPA and Quiz 1 scores.
Furthermore, the analysis was qualitative only with the quantitative data, which results in limited understanding of the results. For instance, students’ learning style, teaching methodology, and student involvement were not considered. Multiple regression analysis may have yielded a more complete picture of the complex relationship of multiple variables and given a more complete explanation for multiple variables contributing to student academic performance and their contribution overlapping. Considering the limitations will be helpful to enhance the efficiency of future studies.
Application
It is not unusual in nursing education and practice for a correlation study to be conducted to examine the possible important relationship between certain variables. For example, research can be conducted to determine how many clinical simulation hours completed correlate with students’ performance on the National Council Licensure Examination for Registered Nurses (NCLEX-RN), or the effect that practicum hours have on the success of licensing. Similarly, studies can examine the correlation between the nurse-to-patient ratio and medication mistakes in healthcare facilities, as early academic accomplishments (like performance on Quiz 1) can be correlated to performance on later tests.
Furthermore, correlation analysis can explore the association between post-discharge telephone follow-up and hospital admission to check the link between early intervention and subsequent health outcomes in other healthcare settings. The previous examples demonstrate the valuable role that correlation analysis can play in providing nurses with information on real-life relationships between significant variables in clinical, educational, and health care environments.
Correlation studies have provided evidence that has helped shape initiatives seeking patient safety and enhanced healthcare system efficiency by looking at desirable relationships among healthcare processes and patient outcomes. The examples illustrate the use of correlation analysis as a practical tool for uncovering meaningful associations that inform nursing research, can be used to guide changes in clinical practice, and can help with effective healthcare interventions.
The null hypotheses rejected in the statistically significant correlation analyses suggest there are meaningful relationships that can guide evidence-based practice. The outcomes of the correlation analyses allow nurses to design focused improvement plans to answer questions relating to healthcare delivery and education issues. Overall, correlation analysis plays a crucial role in the successful implementation of quality improvement efforts, nurse care models, and healthcare system decision-making.