
t-Test Application and Interpretation
Student Name
RSCH-FPX7864
Capella University
Prof. Name
Submission Date
RSCH FPX 7864 Assessment 3 applies an independent samples t-test to compare exam scores between students who attended review sessions and who did not. Statistical hypothesis testing is an essential part of quantitative healthcare studies. T-test is usually used to find out whether the variation in the mean of two different populations is statistically significant or not (Yu et al., 2022). The variable in the study is the variable review-1, which depicts whether a student has seen the session and is coded as 1, i.e., no, and 2 i.e., yes. The last variable is a number that represents the number of correct answers one makes in the examination. Applying the identified approach to analysis will allow conducting a rigorous, fact-grounded analysis of whether the installation of the preparatory sessions is correlated to the difference in achieved academic performance.
Data Analysis Plan
Research Question
Does a big difference exist in exam scores between those studying with corrective sessions and those who do not attend such sessions?
Variables
- Independent Variable (IV): The scholastic performance going through review sessions (review-1), two levels: 1 = not attended, 2 = attended. The t-test is a grouping aspect of the variable.
- Dependent Variable (DV): Examination score (final), continuous (number of correct answers in the exam). The scores are in arithmetic counts, and it is therefore possible to calculate the means, standard deviations, and differences among group means.
Null Hypothesis (H0):
There is no significant difference between the means of exam scores (final) of the students who attended the revision sessions and the students who did not attend the revision sessions.
H0: mean score attended group = mean score not attended group.
Alternative Hypothesis (H1):
There is a significant difference in the mean exam scores (final) of students who attended the revision sessions and those who did not attend the revision sessions.
H1: mean score of the attended group ≠ , mean score of the not attended group
Since the independent variable is categorical (two levels: attended and not attended) and the dependent variable is continuous (exam scores), an independent samples t -test would be appropriate to test the existence of a statistically significant difference in the means of the groups.
Testing Assumptions
Levene’s Test Assumption Check
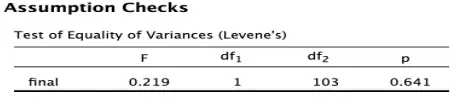
The homogeneity of variance test conducted by Levene presented a result of F = 0.219 with a p-value of 0.641, indicating that there is no significant difference between the variation of scores of students who were tested in the review session and those not tested in the review session. The p-value is more than alpha (0.05), hence the equal variance assumption is true. Therefore, one can adopt the form of the independent samples t-test, which assumes equal variances. Since there are presented the number of degrees of freedom in the form of df1 = 1 and df2 = 103, the analysis does not show any evidence allowing to reject the null of homogeneity.
According to the methodological literature, it is possible to make an insignificant finding with the help of the Levene test (p >.05) to support the assumptions of the same variance that the traditional independent samples t-test presupposes (Zhou et al., 2023). There were 105 students in the sample, the average of each group was different, but the distribution of scores in both groups was the same, and there was no need to perform any other calculation (Welch t -test).
Results and Interpretations
Descriptive
Independent Samples T-Test
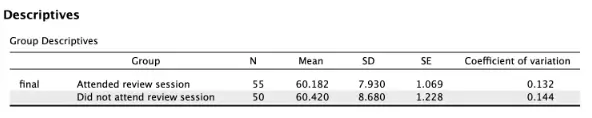
An independent samples comparison was performed in order to determine the effect of attending preparatory sessions on the results of examinations. The sample size was 105 students, 50 of whom had attended the preparatory courses, and the remaining 55 students had not attended any extra learning. Descriptive statistics did not clearly indicate any difference between groups. The average score of absent students was a little bit higher: M = 60.420, SD = 8.680, compared to M = 60.182, SD = 7.930 of the students who attended the sessions. Before the hypotheses were tested, the assumption of checking the homogeneity of the variances was tested, and this was done using the Levene test.
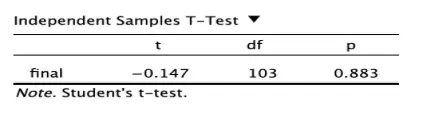
The finding was not significant, F(1, 103) = 0.22, p = .641, which indicated that the assumption of equal variances was correct, and an equal-variances independent samples t-test was allowed. Results of the t-test indicated that the two sets of scores did not differ significantly in the examination of the two groups, t(103) = -0.147, p = 0.883. Given that the p-value was much lower than the level of significance of 0.05, the null hypothesis was accepted. Statistical instructions indicate the homogeneity assumption fulfilled in the event of insignificance of Levene (p > .05), whereas the lack of significance of the independent samples t-test (p > .05) is the case where no worries exist to draw the conclusion about an important difference in the group mean (Yu et al., 2022).
The observed difference of 0.238 that is under consideration can be discussed as not having either statistical or practical significance of absolute value, as the difference is less than 1% change in overall performance. The identical sets of standard deviations (7.930 and 8.680) denote, also, the same dispersion of the scores. Combined, the findings suggest that enrollment in additional preliminary lessons did not have any measurable effect on the end-examination achievement to disprove the belief that the more exposure to teaching, the higher the academic outcome.
Statistical Conclusion
The analysis of the outcome of the exam has shown that the difference between the students who enrolled in the revision sessions (n= 55, M= 60.182, SD=7.930) and those who did not enroll in the revision sessions was a trivial less than 1 percent difference. The homogeneity assumption test made with the Levene test resulted in an insignificant value (F = 0.219, p = 0.641), and gave the opportunity to use the equal-variances independent samples t-test. No statistically significant difference in the means was found, t(103) = -0.147, p = 0.883, and the difference in the means was only 0.238 points. The null hypothesis of no difference in examination performance was kept as the p-value was considerably greater than the 0.05 value. Altogether, the results indicate that the existing organization of the review sessions does not seem to have any significant effect on academic performance.
Limitations and Alternative Explanations
The findings could have been affected by a number of methodological problems. Although the independent samples t-test is applicable in order to compare the means of two groups, other factors (such as past academic performance or study habits) may also affect the results, but they are not considered by the test. The fact that the sample size (n = 105) is small can also impact the statistical power needed to find smaller yet significant differences between the groups. Even the attendance at the review sessions is reduced to a yes/no fact, also leaving out other important considerations, such as whether there are numerous attendances and how long each of the review sessions is attended.
Methodological research holds that a small sample size, the absence of confounding variables measurement, and dichotomy of a continuous or even a complex variable will reduce statistical power, and can potentially result in biased or incomplete findings (Gan, 2025). The perceived effectiveness of the review sessions could also be affected by when the sessions are held, towards the final exam. In the future, the variables ought to be compared using multivariate analysis to take into account the confounding variables and to determine the effects of the preparatory session on a larger sample of students.
Application
The differences in the pass rates on the first attempt of licensure examination of the nursing students who underwent various education strategies can be tested using an independent samples t -test. The independent variable in this case would be the sort of training that was followed during the training process, e.g., structured high-fidelity simulation and traditional hospital-based clinical placements, and the dependent variable would be the pass rate thereof at a specific period of time. The first-time licensure success rate is considered to be the most popular indicator that can be used to determine the quality of a program, as well as the graduates’ readiness to work.
This is why the specified indicator is (academically and strategically, specifically) significant to measure the impact of simulation-based curricula on the outcomes of exams. The reconstruction of complex clinical scenarios in controlled conditions is known as high-fidelity simulation, and it is one of the opportunities that can enable students to practice the desired skills, build clinical reasoning, and address their mistakes without endangering their patients. Immersive simulation enhances the diagnostic reasoning, prioritization, and accuracy of decision-making because of the experience of learning (Medel et al., 2024).
Results of comparative statistical tests can be used to inform changes in the curriculum, accreditation standards, and help provide data-driven allocation of resources in nursing education. The empirical data available demonstrate that a structured framework of deployed simulations is associated with an increase in the level of clinical skills, the results of critical thinking, and the effectiveness of education in general (Saghafi et al., 2024). Clearly, evidence-based simulation methodologies can be combined in a strategic manner in order to contribute to the production of better graduate competency and program outcomes.
For the next and 4th assessment of class RSCH 6874 visit: RSCH FPX 7864 Assessment 4
