
Student name
RSCH FPX 7864
Capella University
Professor Name
Submission Date
The analysis of variance (ANOVA) is a statistical technique tool to compare the mean scores of three or more groups to determine if they are significantly different. The test helps to identify whether the difference between group means is due to random error or not. ANOVA is a widely used technique in research to compare experimental and comparative studies and to draw sound conclusions from research hypotheses (Staff, 2025). An Analysis of Variance (ANOVA) is used in this study to compare the Quiz 3 correct answer scores of the various sections of each class.
Section and Quiz 3
Section is the independent variable and is categorical with three levels (or groups): Section 1, Section 2, and Section 3. The Quiz 3 score is a continuous variable that is the dependent variable (the number of correct answers). The mean scores of the groups are compared using ANOVA.
Research Question
Do there exist any significantly different numbers of correct answers on Quiz 3 for various classroom sections?
Null Hypothesis (H₀)
The difference between the correct answer rates for Quiz 3 across the four groups is not significantly different.
Alternative Hypothesis (Hₐ)
The difference between the various classroom sections in Quiz 3 correct responses is significant at the 95% confidence level.
Testing Assumptions
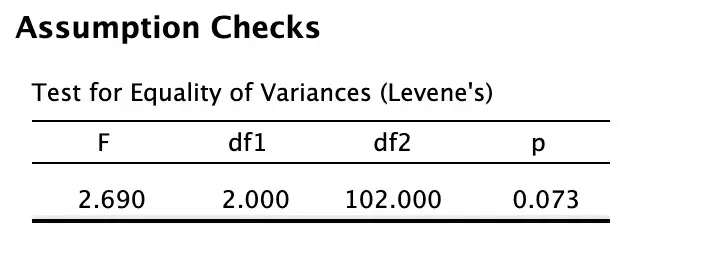
The score variances for the groups were tested for equality using Levene’s test before performing the ANOVA test. This is required as it is assumed that the variability within each group is relatively equal (ANOVA, Staff, 2025). The results of Levene’s test showed an F value of 2.690 with df1 = 2 and df2 = 102, while the p-value was 0.073. The differences in variances were not considered statistically significant as the p-value was higher than 0.05. These were the results that supported the assumption of equal variances, and thus it was determined that the analysis of variance was appropriate for comparing Quiz 3 scores for the various class sections.
Results and Interpretation
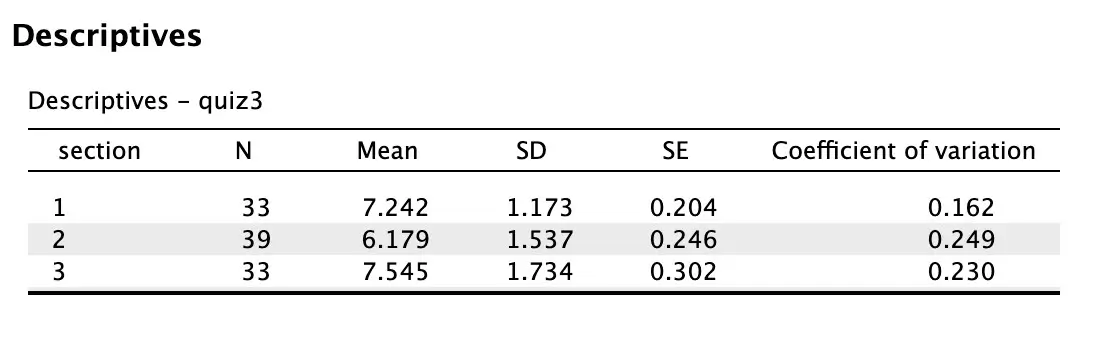
The values for mean (M) and standard deviation (SD) for Quiz 3 outcomes are presented below for all groups, organized according to the section variable.
- Section 1: M = 7.242, SD= 1.173
- Section 2: M = 6.179, SD= 1.537
- Section 3: M = 7.545, SD= 1.734
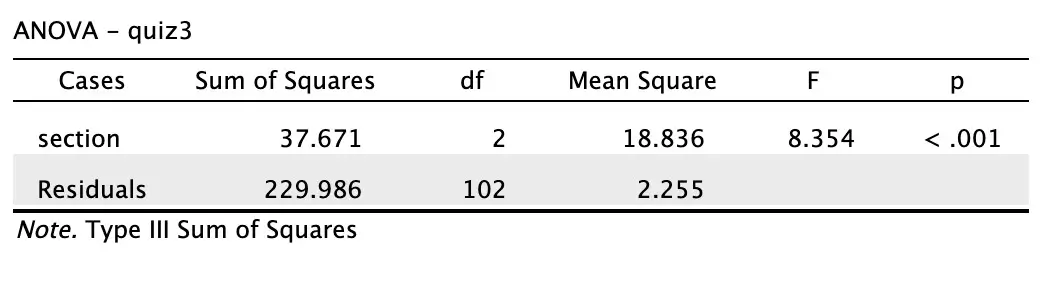
When analyzing Quiz 3 results among the three classes, it was evident that there were differences in the average grade. Students in the section had the highest mean score (M = 7.545) and a standard deviation (SD = 1.734), which means that students in the section performed better overall than students in the other groups. Section 1 had the second-highest average score (M = 7.242, SD= 1.731). The lowest mean score was seen with Section 2 (M = 6.179, SD= 1.537), which showed lower overall performance than Sections 1 and 3. One-way ANOVA was used to see if the differences were statistically significant.
The analysis yielded an F value of 8.354 for df1 = 2, df2 = 102, and a p-value of < .001. The differences between the section means were considered statistically significant, as the p-value was much lower than the .05 significance level. The finding resulted in rejection of the null hypothesis, which claimed that there is no difference in the conclusion scores obtained on Quiz 3 between the three sections. The results showed that there was a very large difference between the group means and within the groups. Overall, results correspond with the alternative hypothesis and establish that there was a significant difference between the scores of Quiz 3 across the three sections of the classroom.
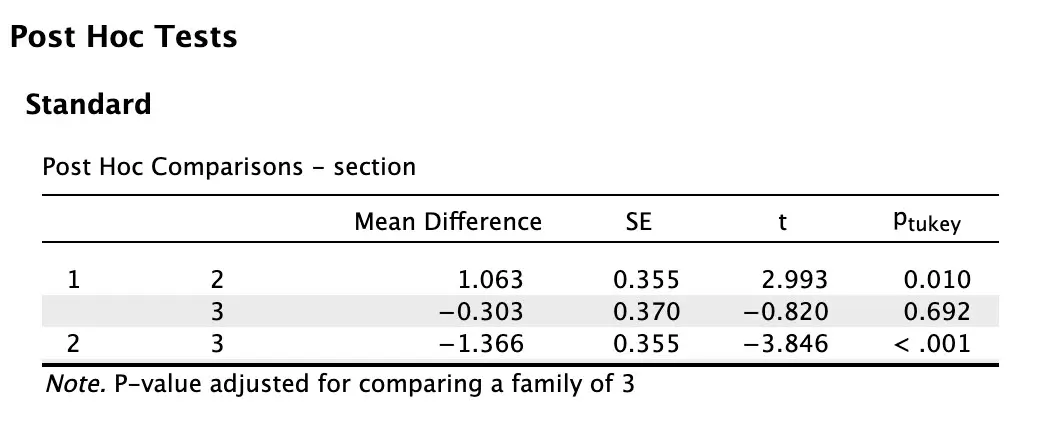
To determine differences between the scores on Quiz 3 in the different classroom sections, Tukey’s Honestly Significant Difference (HSD) test was used. Since the p-value derived from the results was lower than a significance level of 0.05, there was a significant difference between the two sections (Section 1 and Section 2). These students’ average scores were higher (M = 7.242) than the students from Section 2 (M = 6.179). The other difference that seemed meaningful was between Sections 2 and 3 (p-value of 0.001). The highest mean score (M = 7.545) was for Section 3, indicating its better academic performance compared to Section 2.
The p-value obtained from comparing Section 1 and Section 3 was 0.692, which is greater than 0.05, indicating that there is no statistically significant difference. There was very little difference in mean scores between the two sections; however, a marginally higher mean score was found in Section 3. The correlation of the t-values also confirmed the statistical results. The comparison of Section 1 with Section 2 yielded a t-value of 2.993, which means that there is a meaningful difference between the two treatments, while the t-value of -3.846 on the comparison of Section 2 with Section 3 showed a bigger difference in performance. Signs of overall lower performance in Section 2 when compared with Section 1 and Section 3 were shown in the post hoc analysis results; and there was no significant difference between the achievement in Section 1 and Section 3.
Statistical Conclusions
The scores obtained from Quiz 3 were compared among the three sections by using one-way ANOVA. The mean scores did not agree with the null hypothesis and were statistically significant at F (2, 102) = 8.354, p < .001. The homogeneity assumption was confirmed by Levene’s test, which yielded an F = 2.690 with a p-value of .073. Mean scores were 7.242 (SD= 1.173) for Section 1, 6.179 (SD= 1.537) for Section 2, and 7.545 (SD= 1.734) for Section 3.
Tukey’s test indicated that the performance in Section 2 was not significantly different from Results 1 and 3. There was no statistically significant difference between the scores obtained by Section 1 and Section 3, but Section 3 obtained a higher mean score. The scores also varied by section, indicated by score patterns, which could be the result of section-related factors such as teaching style or learning conditions that may have contributed to the lower scores in Section 2.
Limitations
When interpreting the results of an ANOVA, there are several things that should be considered. The equal variance assumptions were valid, and normality within each group was not tested. Tukey HSD helped reduce the risk of a Type 1 error for making comparisons between groups, but there was no way to rule out any erroneous Type 2 error conclusions (Geraghty, 2022). Variations among teaching approaches adopted, the curriculum, and even when students take their quizzes were not investigated. A lack of such a gap reduces the chances of establishing any causation. One possible drawback is that perhaps there are some differences in the size of the groups, but they are not described.
Application
ANOVA is also important in medical research because ANOVA makes it easier to compare the results when various methods are used in treating patients. For instance, ANOVA may be utilized to compare the effectiveness of the therapy that is applied to the patients who are treated with medication, lifestyle changes, and/or both.
This analysis will enable healthcare practitioners to determine the treatment method that contributed to the positive health outcome. In addition to the above, other reasons which could be analysed with ANOVA are the rate of recovery, pain management, adherence to intervention/treatment plan, and the rate of rehabilitation after each type of intervention (Staff 2025).
The ANOVA allows one to analyse multiple groups together and hence provides a wider range of analysis than other forms of statistical techniques. According to Cui (2025), a study showed that the effectiveness of interventions and treatment in the healthcare sector contributes greatly to the rate of recovery of patients from illnesses.
Example Of ANOVA:
An education study of nursing could investigate relationships between the method of nursing education and students’ scores on clinical competency assessment.
Research Question: What is the difference between the scores achieved by students receiving high fidelity simulation, traditional clinical instruction, or hybrid instruction on a clinical competency examination?
Independent Variable (IV): Teaching method (categorical variable with three groups): high fidelity simulation, traditional clinical instruction, and hybrid instruction.
Dependent Variable (DV): Clinical competency score, a continuous variable measured as a total score on a standard assessment. ANOVA is used to compare the mean scores for the three teaching groups.
Example Application of ANOVA
A nursing education study may examine whether teaching methods are associated with differences in clinical competency scores among students.
- Research Question: Do students who receive high-fidelity simulation, traditional clinical instruction, or hybrid instruction earn different scores on a clinical competency examination?
- Independent Variable (IV): Teaching method, a categorical variable with three groups: high-fidelity simulation, traditional clinical instruction, and hybrid instruction.
- Dependent Variable (DV): Clinical competency score, a continuous variable based on the total score earned on a standardized assessment. ANOVA compares the mean scores among the three teaching groups.
Hypotheses:
Null Hypothesis (H₀): There is no difference between the students’ performance in the clinical competency exam who are learning from high-fidelity simulation, traditional clinical instruction, and hybrid learning.
The Alternative Hypothesis (Hₐ): There is a difference in clinical competency exam scores between students receiving high-fidelity simulation, traditional clinical training, and a combined clinical and high-fidelity simulation learning experience.
[/blur_section]