

Proposal to Administration: Spreadsheet and Video Presentation
Student name
Capella University
NURS FPX 6424
Professor name
Submission date
Introduction
Greetings, administrators. This is a video and spreadsheet presentation, and I am ______ to be your host. I will share conclusions and recommendations about the 30-day readmission rate of heart failure (HF) patients. Local providers’ 30-day readmission rate is an ideal measure of care coordination effectiveness. There is evidence that issues with care co-ordination, such as failure to plan discharge, failure of follow-up, and failure of self-care, are associated with high numbers of readmissions (Macchio et al., 2020). When used in conjunction with EHRs, predictive analytics, and clinical decision support systems, the Iowa Model can help identify patients at risk of readmission, target individual patient interventions, and, finally and most importantly, decrease readmission rates.
Analyzing What, why, and how to measure a Specific Quality Outcome
We investigate on a patient level the reason for the 30-day readmission in HF patients, including medication adherence, patient follow-up rates, patient satisfaction, and weight change. The “What” is composed of the variables, readmission rate, and secondary indicators, reviewed monthly to monitor the situation as well as identify improvements. This is to facilitate care coordination, to decrease rehospitalization, and to map the CMS’s expectations (Anawade et al., 2024). “How” data are gathered from electronic medical records, data analysis is performed to identify risks, surveys, and records of medication administration and usage are completed with patients. In doing all these things, we are monitoring patients’ progress fully, so we make decisions with data for better long-term results.
Note that the main outcome being analyzed is the 30-day readmission rate of patients with heart failure. This indicator is a benchmark approved by the Centers for Medicare & Medicaid Services (CMS) and calls for rates less than 20% (Macchio et al., 2020). Reaching or surpassing this standard is an indicator that care teams have done a good job of filling in the gaps in transitional care.
In addition, readmission rates, as well as indicators of medication adherence, attendance at follow-up appointments, patient satisfaction, and average weight gain, each associated with successful chronic disease management, are among the secondary benchmarks (Baryakova et al., 2023). The following benchmarks are measured once per month to enable appropriate, timely course corrections. Regular measurement also helps to provide equality with national performance standards and data-driven decision-making.
Data collection methods were planned and conducted in a way that clinical and behavioral determinants of readmission were included in data collection. Objectively gathered clinical data, such as discharge date, readmission status, and recorded symptoms, such as weight gain or dyspnea, can be obtained in an EHR extraction. Predictive analytics algorithms are then able to detect any patients who are displaying the risk indicators by analysing that data, such as a sudden weight gain of more than 2 pounds in 24 hours.
Medication Adherence Calculations take into account Pharmacy Refill Records and Patient Self Reports, and the same applies for Follow-Up Attendance Rates, which are derived from Outpatient Scheduling logs. Insight into engagement and perceived quality of care is captured via patient satisfaction surveys, such as the Hospital Consumer Assessment of Healthcare Providers and Systems (HCAHPS), using validated questionnaires. Having these data on a monthly basis allows for trend analysis, positions any intervention as early in life, and allows for evidence-based practice and collaboration with stakeholders in the Iowa Model.
Analyzing Quality Outcome Data Trends
Data measurement and trending evaluation are about determining the relative change in the data measures from month to month against the benchmark set. For instance, the admission rate dropped 6% (from 22% in January to 16% in June). This is in conjunction with an increase in medication adherence from 70% to 85%, during the same time frame, as well as an increase in follow-up rates (55% to 75%).
The greater proportion of days covered (PDC; %), the lower the probability of hospital admission, with a decrease of 6% for each 10% increase in PDC of cardiovascular medications, according to Pham et al. (2022). Moreover, the patient satisfaction rate also improved, increasing from 65% to 78%, which demonstrates patient engagement and the quality of care provided. Average weight gain dropped from 5.2 lbs to 3.5 lbs in 6 months, and this is one of the initial signs of fluid buildup in heart failure.
Nurses and pharmacists could have been able to intervene rapidly as weight gain, TURQUOISE red flags, nonadherence, and missed appointments were identified via real-time queries in the EHR; these interventions could have included diuretic dose adjustments, reinforcing education, or set up telephonic evaluations. Sutton et al. (2020) demonstrated that integration of the CDS into the EHR affects these workflows, which helps reduce fragmented care.
In fact, following the implementation of an EHR-based notification system back in March, the service line had a 25% increase in Patient Satisfaction and an 18 % reduction in readmission by June. They are all interdependent and offer solid evidence that informatics-based interventions, along with the Iowa Model, are resulting in significant improvements in quality.
As observed, the above adherence had been increasing from the 70% in January to 85% in June, while the readmission rate had been decreasing. In this alignment, the relationship between patient behaviours and clinical outcomes is emphasized.
Table 1: Healthcare Outcome Trends by Month
Month | Readmission Rate (%) | Medication Adherence (%) | Follow-Up Rate (%) | Patient Satisfaction (%) | Avg Weight Gain (lbs) |
January | 22 | 70 | 55 | 65 | 5.2 |
February | 20 | 74 | 60 | 68 | 4.9 |
March | 19 | 77 | 63 | 71 | 4.6 |
April | 18 | 80 | 67 | 73 | 4.2 |
May | 17 | 83 | 72 | 76 | 3.9 |
June | 16 | 85 | 75 | 78 | 3.5 |
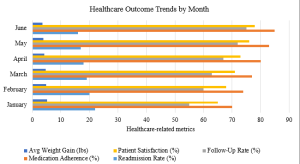
The horizontally grouped bar chart effectively visualises those very same numbers in a way that creates a visual narrative. The graph displays five bars in each month up to June, on the y-axis, with each bar color corresponding to a different metric (Average Weight Gain, Follow Up Rate, Patient Satisfaction, Medication Adherence, and Readmission). By observing this way, the relationship between average weight gain (shortest bars) and follow-up rate, patient satisfaction, medication adherence, and readmission rate (longer bars to the right) within a single month is immediately apparent (see Figure 1).
Most of the bars are getting longer over the six months, which reflects improvement and satisfaction as well as adherence to the prescribed medication, with the Readmission Rate bars getting shorter from month to month, reflecting decreasing readmission rates. The spreadsheet allows you to see exact figures for an in-depth investigation of these metrics. The bar graph clearly shows the rolling representation of these five measures and their impacts on overall readmission rates, including positive changes in adherence and satisfaction.
Figure 1: Healthcare Outcome Trends by Month
Conclusions and Recommendations
Use other data feeds, such as social determinants of health, with predictive analysis approaches and customize risk-stratification models based on these. Second, make discharge instructions created in the EHR more patient education-oriented and automatically tailored to the individual patient’s risk. Third, have multidisciplinary care huddles every other week to follow up flagged patients as high risk, making people accountable for following up and managing resources. Fourth, leverage the support of Telehealth to provide virtual monitoring of weight and to provide medication counseling, particularly for those in remote and underserved areas (Anawade et al., 2024).
Finally, conduct a review period on a quarterly basis to see how other regional and national results relate, such as the use of a balanced scorecard for clinical, financial, and patient-reported outcomes. These recommendations also mirror CMS’s program of pay-for-performance in an integrated care system, which aims to enhance results through data-supported and collaborative interventions, towards a continuum of quality improvement.
Data Collection Methods: The methods that will collect the data will be important to understand why people with heart failure are readmitted to the hospital. Extracting information from EHRs can help provide timely and accurate data on how long and how fast patients are discharged and re-admitted, which can be used to measure a person’s overall outcomes (Brown et al., 2022).
With predictive analytics, it is possible to determine which patients are at high risk early on, based on their clinical data, such as weight gain, which may indicate fluid in patients with heart failure. Helping to identify adherence to the patient’s medications – through a mix of self-report and the patient’s medication fill history – is one of the biggest factors in reducing hospital readmissions.
Next Assessment: NURS FPX 6424 Assessment 4
