Student name
Capella University
MHA FPX 5017
Professor name
Submission date
Statistical analysis is a highly important tool to identify focus areas of health care systems. To keep data integrity and to replicate the research results, good statistical analysis is essential (Panos and Boeckler, 2023). In this assessment, the overall performance of a healthcare facility is assessed in terms of statistical analysis and graphical presentation of information on the readmission rates. Statistical calculations were carried out using the Analysis Toolpak in MS Excel, and the results were analyzed. Furthermore, in this evaluation, the correspondence of the results in the interpretation with the literature is explained.
Descriptive Statistics Test
In a quantitative study, the descriptive statistics are very important to describe and summarise the important features of the sets of data. To fully understand the characteristics of the sample, detailed descriptive statistics are needed (Fulk, 2023). The statistics for the descriptive data show a relatively symmetrical distribution of the values around the centre with little difference between the measures of central tendency – the mean readmission rate is 0.1060 (10.60%), and the median is 0.1045 (10.45%). The standard deviation of 0.0487 shows that the range of the readmission rates over the 70 months is rather moderate, and the variance of 0.0024 confirms the moderate data spread.
The variation on this one is quite big, 0.2002, which represents the difference between the lowest value (0.0072) and the highest value (0.2073), and these figures are approximately 20 percentage points from each other. There was a slight negative skewness (-0.0143) and negative kurtosis (-0.6387), which showed that the distribution was flatter than the normal curve with a slightly left-tailed distribution, consistent with the readmission pattern throughout the time of the study, with no outliers. Table 1 below shows the results of the descriptive statistics of readmission rates.
Table 1
Descriptive Statistics for Readmission Rates
Statistic | Value |
Mean | 0.1060 |
Standard Error | 0.0059 |
Median | 0.1045 |
Mode | N/A |
Standard Deviation | 0.0487 |
Variance | 0.0024 |
Skewness | -0.0143 |
Kurtosis | -0.6387 |
Range | 0.2002 |
Minimum | 0.0072 |
Maximum | 0.2073 |
Data Interpretation and Summary
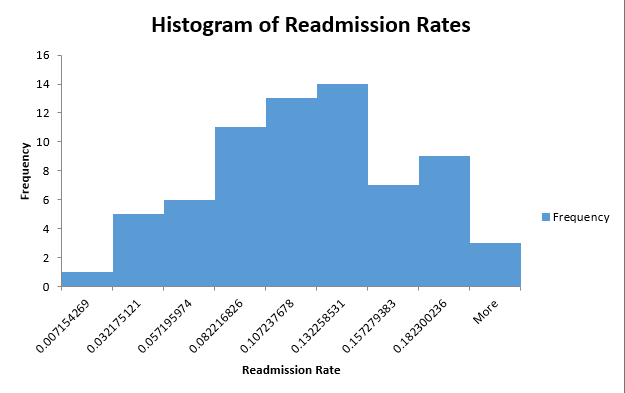
Histograms are a great visual tool and can be used to describe the frequency distribution of continuous data over intervals (called bins). Visual analysis tools, such as histograms, can help identify potential skewness, outliers, or clustering patterns that may not be apparent from the numerical summaries alone (Pannell, 2023). The higher frequencies are found in the middle bins, between 0.107 and 0.132, indicating a peak in the distribution with 27 observations in this range, creating a roughly bell-shaped, unimodal distribution. Healthcare data visualization enables easy and quick detection of trends and outliers in patient outcomes.
The distribution indicates a fairly symmetrical shape, with 11 observations in the 0.082-0.107 interval on its left side and 14 observations in the 0.132-0.157 interval on its right side of the central peak. The frequencies gradually drop off towards both ends, with only a single count in the lowest interval (0.007) and three in the highest interval (above 0.182), indicating that there are few extreme values. The contour of this near-normal distribution indicates that most monthly readmission rates stay within a predictable range of 8-15% readmissions, which is consistent with the readmission pattern and agrees with the descriptive statistics results that this range is relatively consistent with minimal skewness and relatively low variability. The histogram in Figure 1 below shows the distribution of the frequency of readmission rates.
Figure 1
Histogram of Readmission Rates
Recommendation and Plan of Action
From the fact that the mean value of the readmission rate was 10.60% with high variability (SD = 0.0487) the nursing home administration needs to develop a comprehensive program for the reduction of the readmission rate through transitional care management, post-discharge follow-up protocols. There is evidence that structured transition programs are effective strategies for lowering hospital readmissions via better transition care coordination (Pugh et al., 2021). Plan of action should involve setting up a telephone call mechanism for 48 hours after discharge to look out for early complications, setting up medication reconciliation protocols to prevent adverse drug events and creating individual care with specific discharge instructions for high-risk residents (Bhandari et al., 2022).
Since the histogram shows that 20 observations (29%) are above the 10.45% median readmission rate, specific interventions will target the months that have a higher number of readmissions. By frequently monitoring with monthly data analysis, proactive interventions can be implemented, thereby enhancing the outcomes for residents while also lowering healthcare expenses related to avoidable readmissions (Po et al., 2024).
Conclusion
Of the 70 months of readmission data studied in this evaluation, there were 10.60 on average with a moderate standard deviation and a near-normal distribution. The histogram visualization and descriptive statistics revealed similar patterns in readmission with a few outliers, which means that the patterns of performance were foreseeable. Implementation of evidence-based interventions, including post-discharge follow-up plans and medication reconciliation, will be a means towards reducing readmission rates. Monthly control and evidence-based updates ensure continual positive improvement in outcomes for residents and optimal use of healthcare resources and cost-effectiveness.