

Correlation Application and Interpretation
Student Name
RSCH FPX 7864
Capella University
Professor Name
Submission Date
- RSCH FPX 7864 Assessment 2 applies Pearson correlation analysis to examine relationships between student academic performance variables (Quiz 1 scores, final exam scores, total points, and GPA).
Data Analysis Plan
To effectively analyse data, the process needs to be the same as the way of gathering data. The structured framework assists the researcher with a systematized methodology to assess data and therefore find evidence as well as come up with meaningful conclusions based on these assessments (Zebachi et al., 2025). The main aim of the evaluation will be to determine potential relations between key indicators of student academic success (first quiz score, final exam score, cumulative course score, and previous GPA) and to find out the trends of student success that may lead to further innovations in the practice.
The analysis looks into four fundamental variables:
- Quiz 1 Score: The total number of correct responses that can be scored out of the initial quiz test, whose possible amount of scores are limited to 0, to the maximum amount possible. The Score of Quiz 1 is continuous.
- Final Exam Score: A summative numeric scale that determines the number of correct answers that were received throughout the final examination, such that a score of zero to the highest possible score is obtained. Final Exam Score is a continuous variable.
- Total Points Earned: A numerical figure that is used to measure the academic credits earned in all the graded elements of the semester and which range between the lowest possible value of 0 and the maximum possible aggregate of that value. The total points earned are continuous.
- GPA: The general academic performance calculated using a numerical scale, with a range of 0.00 to 4.00, obtained using the weighted mean of grades that are completed regarding all coursework. GPA is a continuous variable.
Total-Final Correlation
Research Question
Does the number of points that students earned in their courses have a significant correlation with their final exam results?
Hypotheses
Null Hypothesis (H0): The cumulative course points have no significant correlation with the end exam performance of students. H0: ρ = 0.
Alternative Hypothesis (Ha): There is a significant relationship between students’ cumulative course points and their final examination performance. Ha: ρ ≠ 0.
Quiz 1 and GPA Correlation
Research Question
Does the grade point average of students have a significant relationship with their average on the first quiz?
Hypotheses
Null Hypothesis (H0): There is no significant relationship between students’ grade point averages and their performance on the first quiz assessment. H0: ρ = 0.
Alternative Hypothesis (Ha): There is a significant relationship exists between students’ grade point averages and their performance on the first quiz assessment. Ha: ρ ≠ 0
Testing Assumptions
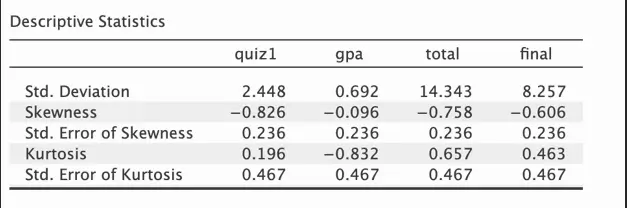
Table 1: Descriptive Statistics
The first step that we need to conduct a statistical analysis is the verification of the data. Validating the data collected is meant to ensure the completeness, accuracy, and reliability of the information (Fu et al. 2024). High-performers (determined by cumulative examination and end-of-term evaluation totals) made up approximately 73.82% of the data set students. Quiz 1 gave the most negative skew (-0.826) of any variable analyzed, and GPA gave the least negative skew (-0.096) of any variable analyzed.
All variables in the study were found to have skewness and standard deviation values within normal ranges, which attests to an acceptable distribution of each variable. To evaluate kurtosis, each variable was evaluated to find out the relative heaviness of the tails of each distribution (longer tails indicate a high probability of an outlier). The kurtosis of all the variables was moderate (-0.832 to 0.657), and no anomalies in the standard deviation of the data were detected.
All the variables were observed to be normally distributed, so as to evaluate the normality of each variable distribution. All skewness values (Total (-0.758), GPA (-0.096), Final (-0.606), and Quiz 1 (-0.826)) were negative and met the criteria for normality, which is between -2 and +2. Kurtosis values were less than the overall value of 3.0 and indicated merely insignificant deviations from normal distributions.
Together, it is possible to conclude that all the variables satisfy the conditions of parametric testing in terms of their normality. Going by the statistical evidence, the null hypothesis on Total-Final correlation (r = 0.659, p = 0.001) was rejected as there was sufficient evidence to prove the existence of a statistically significant relationship between the two variables, whereas the null hypothesis on the Quiz 1-GPA correlation (r = 0.142, p = 0.149) was not rejected as there was not sufficient evidence.
Results & Interpretation
Table 2: Pearson’s Correlations Between Academic Performance Variables
The Pearson correlation coefficient is a statistic used to show both the size (strength) and the nature (direction) of relationships of data that are continuous and can be related to each other by straight lines. The outcome of a Pearson correlation provides a numerical value that indicates the two-variable relationship (Kent State University, 2026). A review of the correlation matrix illustrated numerous significant relationships between the variables of interest.
An analysis of quiz 1 results showed strong correlations to total points scored (r = 0.601, p < .001) and moderate correlations (r = 0.422, p < .001) to final exam results. The relationships between GPA and quiz 1 were weak, non-significant (r = 0.142, p = .149), and minimal with total points scored (r = 0.137, p = .164) as per analysis. Attempts with test results correlated modestly but significantly (r = 0.233, p = .017) with exam performance. The strong relationship (r = 0.659, p < .001) observed was between total points scored and the final exam grade.
Statistical Conclusions
Hypotheses were tested on the correlation of student achievement by assessment type. The correlations suggest that some academic indicators have strong correlations; for example, quiz 1 performance relates very closely to total points achieved (r = 0.601; p < .001), while having only a moderate correlation to performance in the final exam (r = 0.233; p = 0.017) as per analysis. In contrast, grade point average (GPA) only has a small correlation with quiz 1 performance (r = 0.142; p = 0.149), as well as both total points (r = 0.137; p = 0.164) and performance on the final exam.
Thus, the largest correlation evidenced in total points and the final exam (r = 0.659; p < .001) provides a strong basis for the rejection of the null hypothesis. Additionally, statistical results suggest that current term performance is a better indicator of future assessment results than any historical academic performance. Weak and statistically non-significant correlations also exist between quiz 1 performance and GPA (p = 0.149), which further supports the conclusion that prior academic achievement has only a limited relationship to early assessments in the current semester. Overall, educators should consider implementing interventions based on students’ current performance in programs rather than on past academic performance.
Limitations
Several issues limit the ability to conclude from this study’s correlations. The study did not take into account confounding variables that might have distorted or influenced the correlation between the two variables; therefore, these potential confounders were not controlled for statistically. The study was also limited to looking at only direct correlations; therefore, the study did not examine indirect correlations or more complex correlation patterns that could have been examined using multiple regression analyses to better understand data related to GPA and students’ grades on Quiz 1.
Due to the small sample size, the study was unable to provide strong statistical power to test the correlations between the variables being studied, particularly regarding the relationship between GPA and grade on Quiz 1. In addition, the lack of both quantitative and qualitative data is a major limitation of this research. By using mixed methods, researchers are able to gain a better understanding of the many factors that contribute to academic performance (Villalobos et al., 2024).
A multiple regression would also provide greater analytical insight by allowing for the analysis of how multiple independent and one dependent variable relate to each other (Roustaei, 2024). Ultimately, future research, when designed using a broader methodological scope and inclusion of various data collection methods, should improve understanding of the underlying mechanisms that account for the academic relationships observed in the exploratory study.
Application
Correlational research has great potential in nursing education to advance understanding of the relationship between variables that contribute to student & patient outcomes. Examining whether a connection exists between a nursing student’s participation in clinical debriefing sessions (independent variable) and performance on dosage calculation assessments (dependent variable) is essential to understanding the relationship between the two variables. Identifying how frequently students engage in structured debriefing activities and whether increased engagement corresponds with measurable improvements in calculation accuracy and critical thinking skills remains a critical focus of inquiry.
A statistically significant positive correlation between the two variables would suggest that debriefing serves as an effective pedagogical tool for reinforcing medication dosage competencies among nursing students. When leaders have valid and reliable evidence based on correlation analyses of the two variables, researchers can make funding and instructional development decisions with confidence and accountability (Wade et al., 2026). Correlation analysis is one of the core analytical tools for conducting research within the field of education and provides researchers with the ability to determine the presence of an association between two or more variables that affect students’ academic success (Assefa et al., 2025).
Therefore, through the insights gained from correlation analysis of students’ performance-related behaviors, faculty can provide additional academic assistance to students needing to develop basic knowledge prior to accumulating performance deficits in future courses. In particular, nurse educators can use correlation-based information in formulating the framework for interventions that will provide assistance for students based on students’ individual performance trendline data, rather than using historical grade data.
For the next and 3rd assessment of class RSCH 6874 visit: RSCH FPX 7864 Assessment 3
